Collect and Analyze Application and Server Metric Data with Micronaut's Support for OCI Monitoring
Posted By: Todd Sharp on 3/30/2021 1:00 GMT
Tagged: Cloud, Java, Open Source

The Micronaut team over in Oracle Labs have been hard at work on a number of impressive features and framework improvements and they’re moving so fast that I can hardly keep up with all the awesomeness. A few weeks ago an update was released on the Micronaut module for Oracle Cloud and I blogged about the automatic wallet download and configuration for Autonomous DB connections from Micronaut, but there was another feature in that release that I didn’t have a chance to blog about at the time: support for Micrometer Support for OCI Monitoring. This powerful feature uses Micronaut’s support for Micrometer to let your applications report an abundance of valuable server and application insight directly into OCI monitoring where it can be sliced and diced as your team sees fit. You can even create alarms and send notifications based on the metrics collected. Best of all - it’s really simple to use and requires nothing but a bit of configuration in your application. Let me show you how!
Configuring Your App
As I stated just a second ago, it’s really just a matter of configuring your application to collect and report these metrics to OCI monitoring. If you are creating a new app from scratch, make sure to add the oracle-cloud-sdk feature.
Next, as with any feature in the OCI Module, you must configure an auth provider. On my localhost, I just use a config file provider.
Of course, when I deploy to OCI I usually use an instance principal, so my configuration for that looks like so:
Note: Naming the configuration file with the special suffix -oraclecloud will ensure that this config file gets automatically picked up and used when deployed to OCI thanks to Micronaut’s automatic environment detection feature.
Next, add dependencies for micronaut-oraclecloud-micrometer, the OCI Monitoring SDK and the standard Micronaut Micrometer dependencies
Now we just modify src/main/resources/application.yml to configure Micrometer. The namespace and resourceGroup will be how you find your metrics in the OCI console later on.
When the application is launched, it will now start reporting metrics to OCI monitoring!
View Metrics
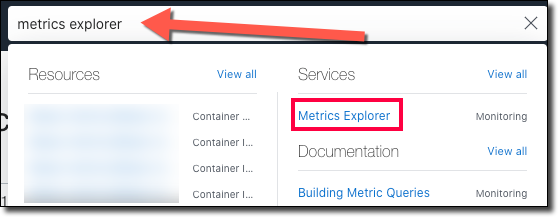
By default, your application and server metrics are reported every 60 seconds (this is configurable). After the application has been running a short while, you can now check the Metrics Explorer in the OCI console to view the data.
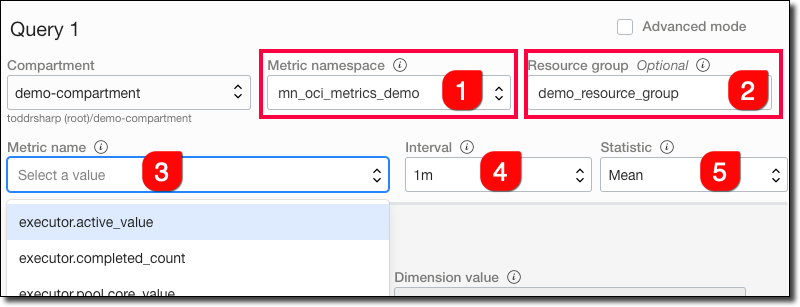
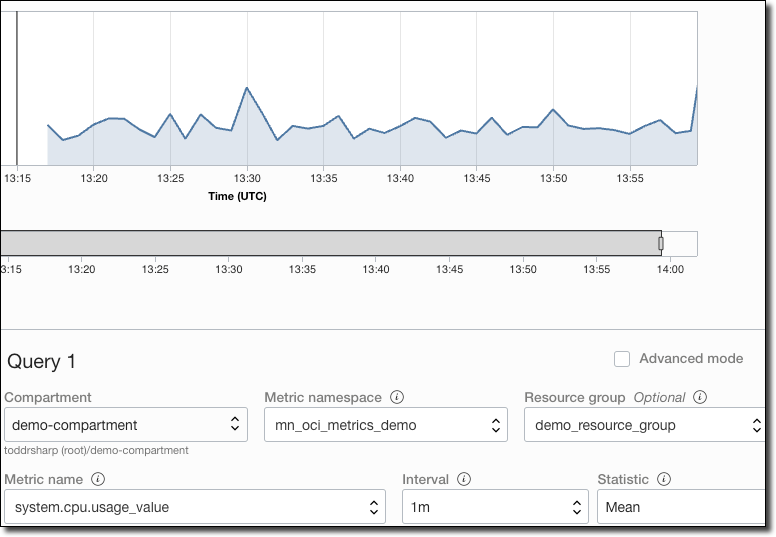
Choose the metric namespace (#1) and resource group (#2) that you entered in your config and then select the metric (#3), interval (#4), and statistic (#5).
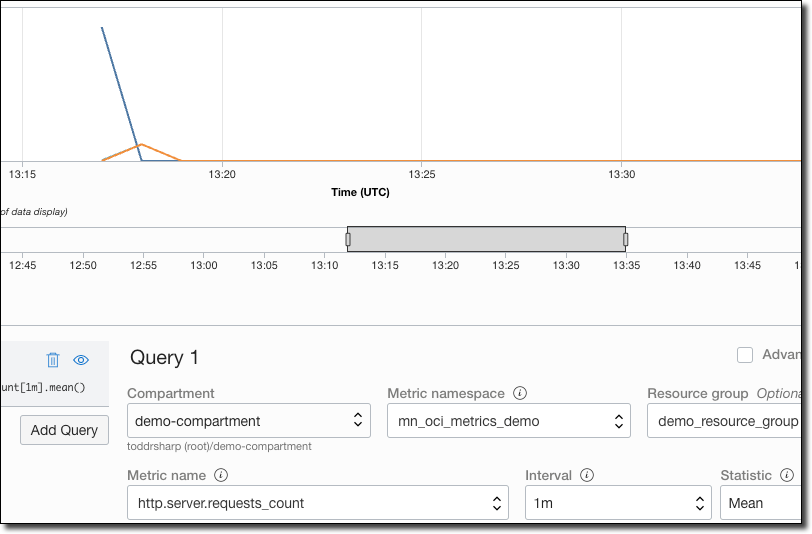
For example, a simple look at incoming HTTP requests.
Or memory used:
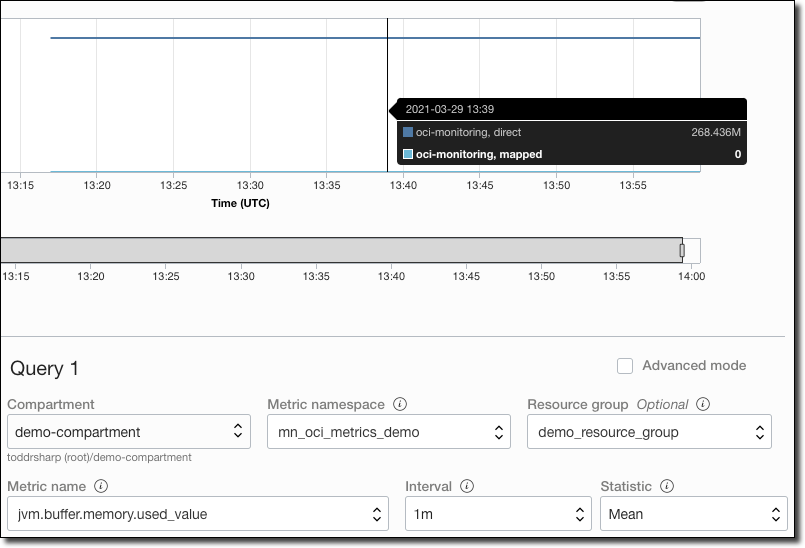
Or CPU usage:
There are a surprisingly high amount of metrics that are reported. Everything from JVM stats, to system metrics like process uptime and system load. You can also enable metrics for Hibernate, JDBC connection pools, or even create your own custom metrics. See docs for more info.
Summary
In this post, we looked at how to configure your Micronaut application to report application and server metrics to the OCI monitoring service. We also looked at how to view the collected data in the OCI console.
Photo by Miguel A. Amutio on Unsplash