Publishing And Analyzing Custom Application Metrics With The Oracle Cloud Monitoring Service
Posted By: Todd Sharp on 4/3/2020 11:00 GMT
Tagged: Cloud, Cloud, Containers, Microservices, APIs, Containers, Microservices, APIs, Database, Database, Java, Java

A few weeks ago one of our awesome Product Managers on the database team came to me with an interesting request. He shared a blog post that someone had published that showed an example of using a different cloud provider’s serverless offering to retrieve some usage data about an Oracle Database and publish that to the provider’s metrics service on a regular basis. The PM asked me how it might be possible to accomplish the same thing in the Oracle Cloud. I was intrigued by the use case and thought it would give me a great opportunity to show off something I haven’t talked much about here on the blog - custom metrics.
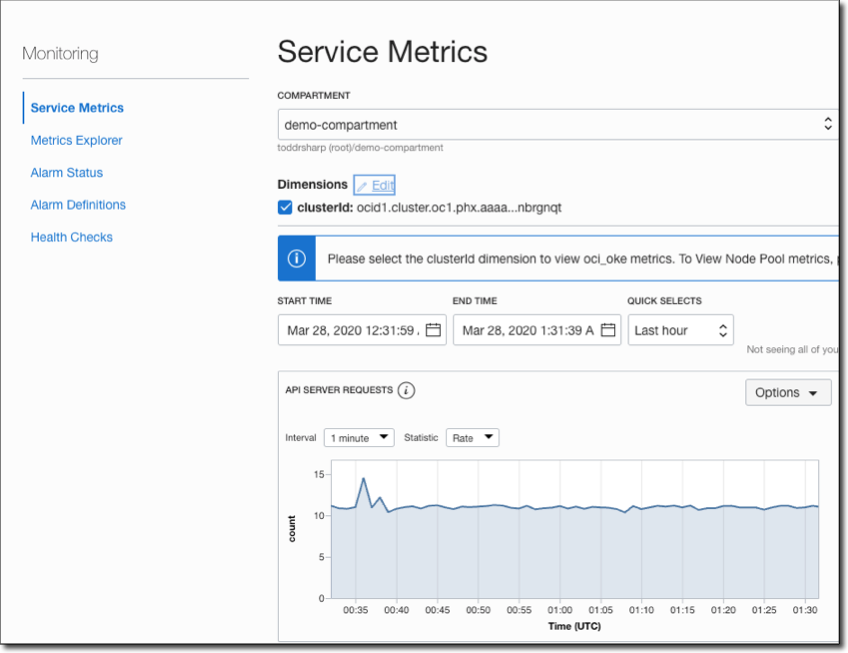
You might be familiar with Monitoring & Service Metrics (if not, read all about them here) which gives you the ability to explore usage statistics for existing services (compute, object storage, etc) and create alarm definitions and much more. This gives you great insight into the utilization and performance of the built-in services on the Oracle Cloud, but what you might not have known is that the Monitoring Service supports custom metrics which allows you to publish your own data to the metrics service that can then be sliced, diced and sautéed into the perfect recipe for your organization’s needs.
Plan Of Action
The article that inspired this little project and blog post suggested that the problem be addressed with a serverless function that is scheduled to run every minute. I know this may be controversial, but in my opinion, that’s just not a good use case for serverless and could end up costing you more at the end of the month. If a serverless function never goes “cold” then I think you ought to look at another solution for your problem. For my approach, I decided it would be better to deploy a simple service to a VM in the cloud that will retrieve the DB utilization numbers with a JDBC query and publish the metric data on a scheduled basis every 60 seconds. The nice thing about this approach is that it’s something that can potentially even be integrated into an existing service or deployed standalone - it’s flexible like that.
Let’s Get Building
How about we walk through some of the code involved in this application to give you an idea of how you might integrate this approach into your existing applications.
Heads Up! We’re talking DB metrics here, but the data that you publish can be anything you need it to be with some minor modifications. Keep reading to learn how to publish custom metrics from your applications!
The approach below uses a Micronaut application, but you can certainly use your favorite framework to build this out. It doesn’t even have to be a web application - you could simply have an executable JAR and schedule it to be called on a periodic basis with CRON! You could even use Python to write a simple script using the OCI Python SDK if you want - the possibilities are endless and there is an approach that will work for just about any environment you can imagine.
DB Metrics Service
The first step in my application is to get the DB metrics for load and storage. The PM that I was working with was kind enough to provide me with the necessary queries to retrieve this data so I created a DBMetricsService that would most of the heavy lifting in this application. The PM gave me separate queries for load & storage data so I created two separate service methods (the full source for this blog post is available on GitHub - see link at the bottom of this post). Here are the two queries I used to gather the data.
DB Load
I plugged those queries into my DBMetricsService and created a simple bean to store the results for each query. I wrapped these in individual service methods named getDBLoad() and getDBStorage()respectively.
Here are the bean definitions to give you an idea of what I’m collecting
Publishing The Metrics
Now that I had a way to pull the data that I wanted to publish to the metrics service, it’s just a matter of utilizing the OCI SDK to publish the metric data. Obviously this meant I needed to include the OCI Java SDK dependency:
Preparing To Use The SDK
We’re going to take advantage of a really cool feature of the Oracle Cloud to authenticate with the SDK and use an Instance Principal provider. Per the docs:
The IAM service feature that enables instances to be authorized actors (or principals) to perform actions on service resources. Each compute instance has its own identity, and it authenticates using the certificates that are added to it. These certificates are automatically created, assigned to instances and rotated, preventing the need for you to distribute credentials to your hosts and rotate them.
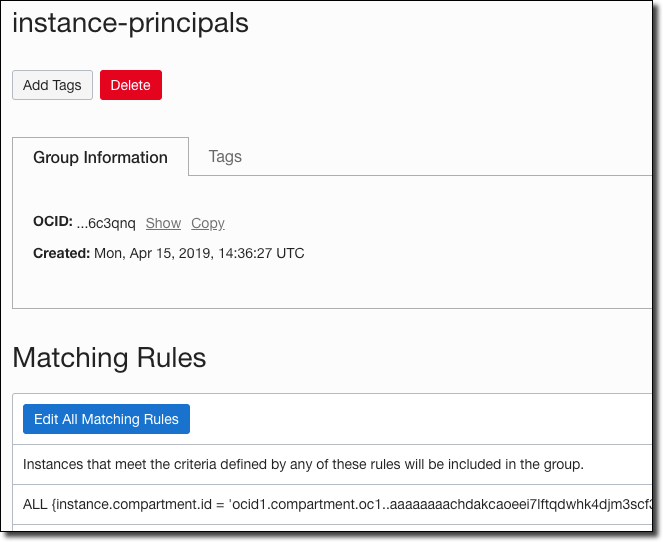
To use instance principals, we need to first create a dynamic group. I call mine “instance-principals” and my rule applies to all instances in a given compartment.
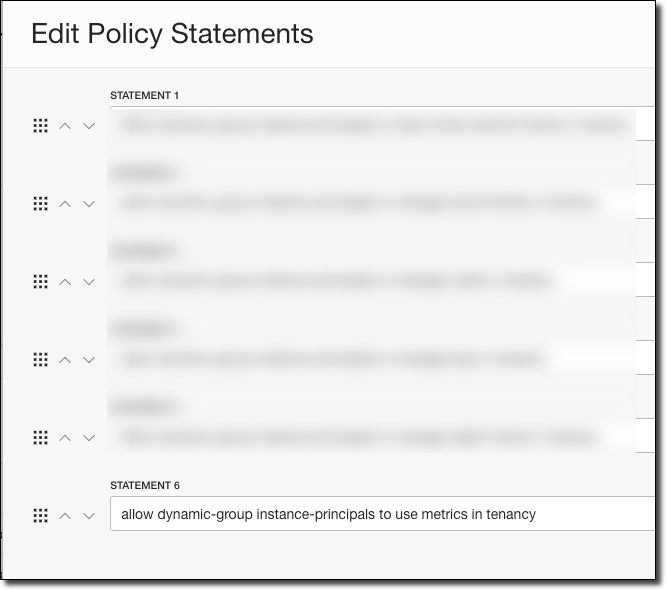
Now it’s a matter of applying the proper policy statements to give the dynamic group permissions.
Publishing Metrics
In the DBMetricsService constructor, we need to create our MonitoringClient. We’ll use the instance principal when running in the Oracle Cloud, otherwise, we’ll use a local config file.
Note: The MonitoringClient uses a different endpoint for POST operations than most other operations, so we need to specify the proper endpoint when constructing our client (or use the setEndpoint()method later on the client). The proper monitoring endpoints per region and operation are listed here.
We need a few variables to publish our metrics. Specifically, we need:
-
The compartment OCID of the compartment in which you’d like to store your metric data
-
A namespace name (whatever you’d like - used to group your metrics)
-
A unique identifier to your metric data (I used my DB OCID)
-
A resource group (whatever you’d like - another sub-level grouping for your metrics)
I stored many of these values in my config bean in my Micronaut app.
Once we have collected that info, we're finally ready to publish metrics! In my publishMetrics()method of the DBMetricsServiceI grab the data and create a list to hold the MetricDataDetails:
Next, we’ll use Micronaut’s Bean Introspection to loop over the properties in my beans, construct the data points and metrics data details objects and add each details object to the list of details to be published. We’ll do this for both beans, but I’ll just show you one since they’re almost identical:
Next, we built a PostMetricDataDetails object, add the list of details and use the MonitoringClient to post the metrics data request.
At this point, we can invoke the service method directly to publish our metrics. I added a controller method to test the publishing:
But it would make more sense to schedule the invocation so that we can ensure a regular stream of metric data is published on a regular basis. To do this, I created a job in Micronaut and used the @Scheduled annotation to invoke the service every 60 seconds.
View Our Published Metrics
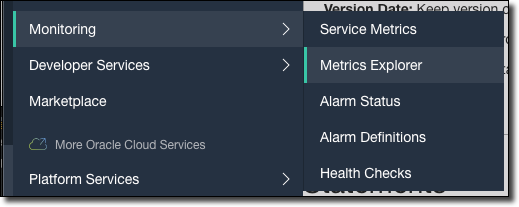
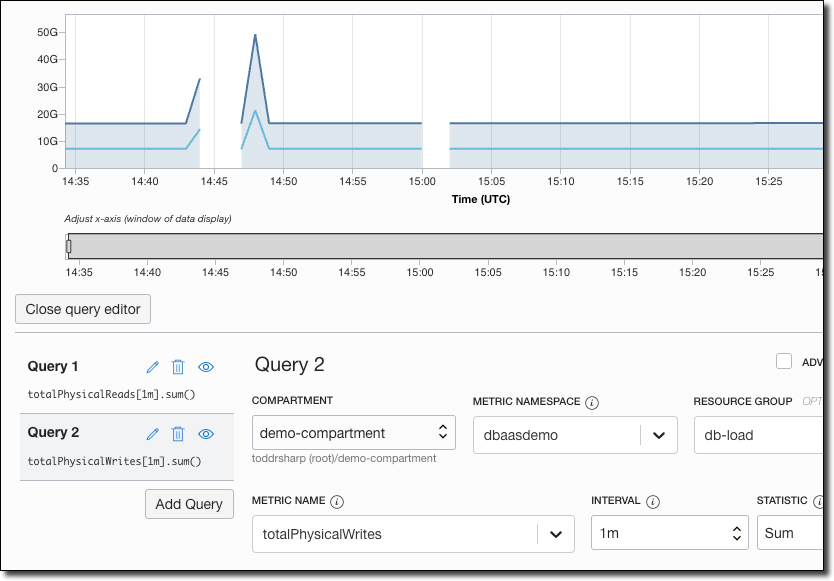
After deploying and running the application for a bit of time, we can view our metric data in the Oracle Cloud console by going to Monitoring -> Metrics Explorer in the burger menu.
In the Metrics Explorer, you can play around with constructing your queries to explore your custom metrics as necessary. Here I’ve created a view to plot out physical reads vs physical writes:
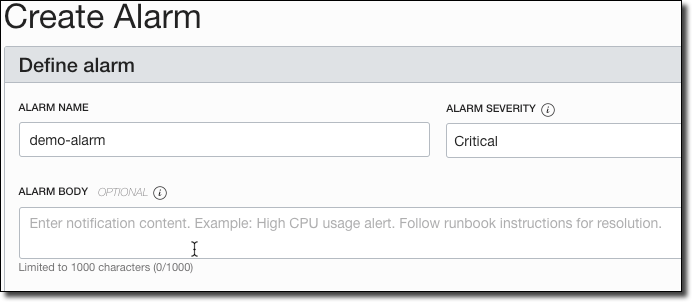
We can also create an Alarm Definition based on these custom metrics. Here’s an example of creating an alarm to send us an email when the mean CPU of the instance is greater than 85% for 5 minutes.
Name the alarm, provide a body and severity.
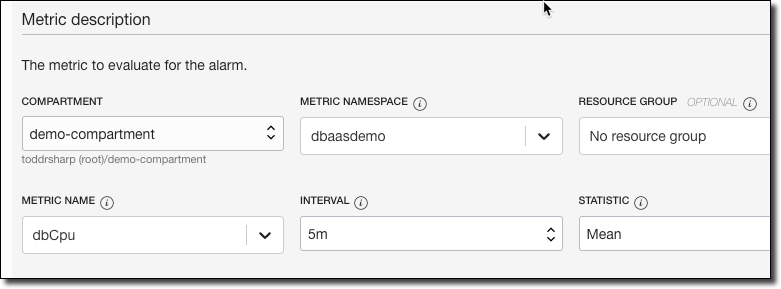
Choose the compartment, namespace, resource group, metric name, interval and statistic.
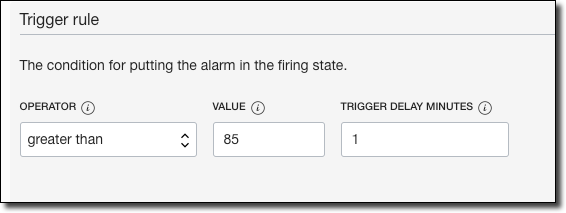
Apply the alarm rule conditions.
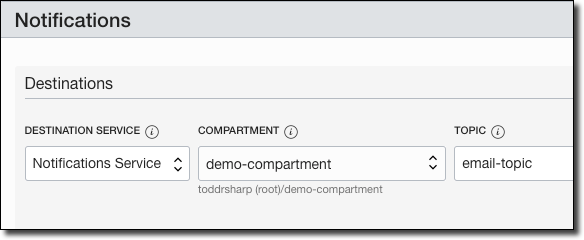
And the destination to publish our alarm when it is breached.
Summary
In this post, we looked at how to publish and explore custom metrics data from your applications in the Oracle Cloud.
Further Reference
- https://docs.cloud.oracle.com/en-us/iaas/api/#/en/monitoring/20180401/MetricData/PostMetricData
- https://docs.cloud.oracle.com/en-us/iaas/tools/java/1.15/
- https://docs.cloud.oracle.com/en-us/iaas/tools/java/1.15/com/oracle/bmc/monitoring/MonitoringClient.html
- https://docs.cloud.oracle.com/en-us/iaas/tools/java/1.15/com/oracle/bmc/monitoring/model/PostMetricDataDetails.html
The full source code for this example is available on GitHub.
Photo by Isaac Smith on Unsplash
Related Posts

Querying Autonomous Database from an Oracle Function (The Quick, Easy & Completely Secure Way)
I've written many blog posts about connecting to an Autonomous DB instance in the past. Best practices evolve as tools, services, and frameworks become...

Sending Email With OCI Email Delivery From Micronaut
Email delivery is a critical function of most web applications in the world today. I've managed an email server in the past - and trust me - it's not fun...

Brain to the Cloud - Part III - Examining the Relationship Between Brain Activity and Video Game Performance
In my last post, we looked at the technical aspects of my Brain to the Cloud project including much of the code that was used to collect and analyze the...