Why You Should Be Using Grafana With OCI
Posted By: Todd Sharp on 3/3/2019 11:51 GMT
Tagged: Cloud, DevOps

A few days ago we announced the availability of the Oracle Cloud Infrastructure datasource for Grafana. I've heard about Grafana quite a bit over the past few years and it was used to monitor our cloud environment in my last project before joining Oracle, but to be perfectly honest I'd never really played around with it myself. This week I decided to change that, and I'm really glad that I did because I've already found practical uses for it that developers who host their application in Oracle's cloud can really benefit from. I won't go into details on how to install Grafana or configure the datasource - the post linked above does a good job of that, so please refer to that to get started. Instead, I wanted to share an immediate benefit that I came across when I created my first dashboard.
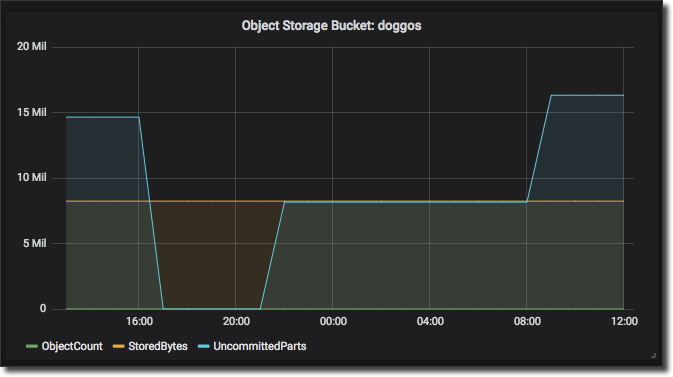
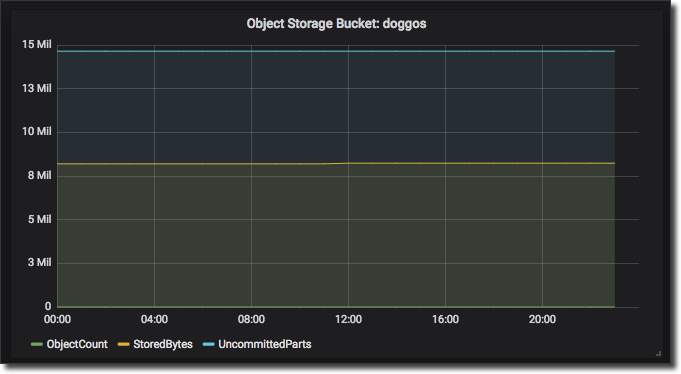
The very first graph that I created was a simple look at my Object Storage buckets. I kept things simple and just added 3 metrics that I thought would be useful: Object Count, Stored Bytes and Uncommitted Parts. Here's how that graph looks as of the time I wrote this article for one of my buckets:

Notice the blue line? Yeah, so did I. In fact, that was the very first thing that jumped out at me. That blue line represents 15Mb of 'uncommitted parts'. In other words, that's storage being used for either in progress, aborted or otherwise uncommitted multipart uploads. Now 15Mb is nothing in the scope of a large, enterprise application. In my case it's just leftovers from when I was testing out multipart upload for another blog post. But for some applications, this number could get large. Really large. A project I was on a few years ago allowed users to upload potentially very large (5-20Gb) video files and handled the uploads via multipart/chunked uploads from pretty much anywhere in the world. Which, as you can imagine, means that from really poor internet connections sometimes. The idea that we could have been paying for potentially terabytes worth of storage for unused files kind of makes me shudder, but with Grafana on OCI you'd be able to quickly and easily keep an eye on these sorts of things. Obviously, it goes much further than this simple example, but I think it illustrates the point well enough.
To clean things up I decided to turn to the OCI CLI and grabbed a list of the outstanding multipart uploads like so:
oci os multipart list -bn doggos --all
To clean them up, unfortunately, you have to manually abort each upload. If you've read many of my posts, you'll know that I am a big fan of Groovy for both web and scripting, so I came up with the following quick script to loop over each stranded upload and abort them:
And cleaned up all of the abandoned multipart uploads. How does your organization use Grafana? Feel free to share in the comments below.
Related Posts

Querying Autonomous Database from an Oracle Function (The Quick, Easy & Completely Secure Way)
I've written many blog posts about connecting to an Autonomous DB instance in the past. Best practices evolve as tools, services, and frameworks become...

Brain to the Cloud - Part III - Examining the Relationship Between Brain Activity and Video Game Performance
In my last post, we looked at the technical aspects of my Brain to the Cloud project including much of the code that was used to collect and analyze the...

Brain to the Cloud - Part II - How I Uploaded My Brain to the Cloud
In my last post, we went over the inspiration, objectives, and architecture for my Brain to the Cloud project. In this post, we'll look in-depth at the...