Adding Tracing to Your Distributed Cloud Native Microservices
Posted By: Todd Sharp on 4/5/2021 1:00 GMT
Tagged: Cloud, Java, Open Source

When adopting cloud-native technologies and certain architectures such as the microservice pattern, observability and monitoring become a huge need and a high priority for many development teams. On the “monitoring” side, I recently blogged about using Micronaut’s built-in support for Micrometer and the OCI SDK integrations to collect and analyze your server and application-related performance metrics with OCI Monitoring. But what about “observability”? It’s just as important to be able to trace and analyze requests across your distributed services so you can obtain a complete picture and be able to pinpoint bottlenecks and issues before they become a real headache. To that end, I want to talk to you about adding tracing to your Micronaut applications. Just as you’d expect, there is plenty of support for adding tracing to your applications in the Micronaut ecosystem. Is it easy to integrate this support into your OCI environment? Let’s take a look.
Tracing Requests with Micronaut
Micronaut features support for integrating with the two most popular solutions for tracing: Zipkin and Jaeger. To get comfortable with tracing, let’s launch Zipkin locally and create two simple microservices that communicate to see how distributed tracing works.
Launch Zipkin
The quickest and easiest way is to launch a Docker container.
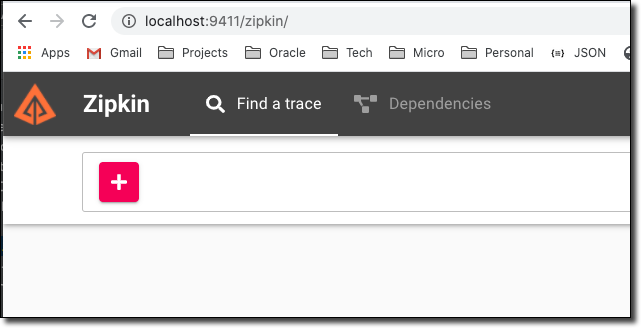
Hit localhost:9411 in your browser to make sure it’s up and running.
Generate & Configure Microservices
Using the Micronaut CLI, generate two services. Include the management and tracing-zipkin features.
Edit src/main/resources/application.yml in demo1 to configure a few variables and point the application at the local Zipkin install.
Configure demo2 to run on port 8081 (to avoid conflict with demo1) and point at the local Zipkin install as well.
Create Controllers
Starting with demo2, create a controller that returns a “favorite number” for a user based on their ID. We use the special annotation @ContinueSpan to indicate that we want to group this endpoint along with whatever request called it in our traces. The @SpanTag annotation on the method parameter lets us pull out specific variables to include in our tracing spans so that we can filter or use them for troubleshooting later on.
Next, in the demo1 service, create a declarative HTTP client that can be used to make calls to demo2 from demo1.
Now we’ll create a controller in demo1 that has a few endpoints for testing. Note that we’re injecting the Demo2Client and making a call to demo2 from demo1 in the /user/{id} endpoint.
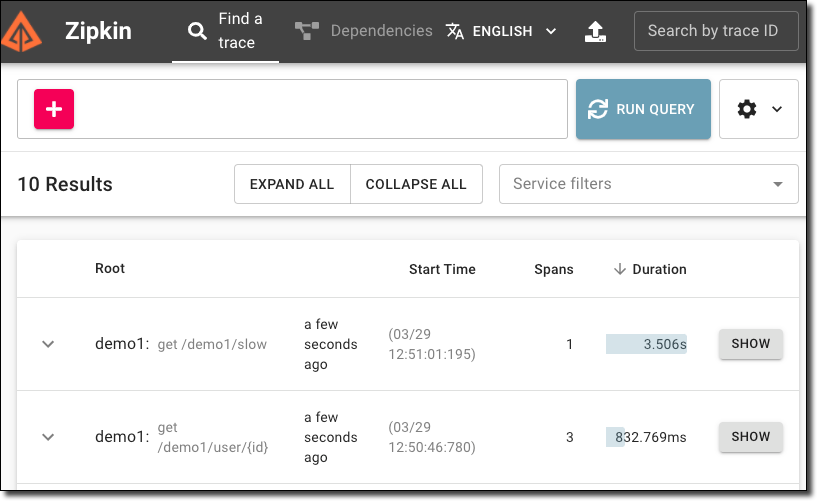
We can run each service at this point and make some calls to the various endpoints. Take a look at Zipkin and see how it handles tracing for the microservices.
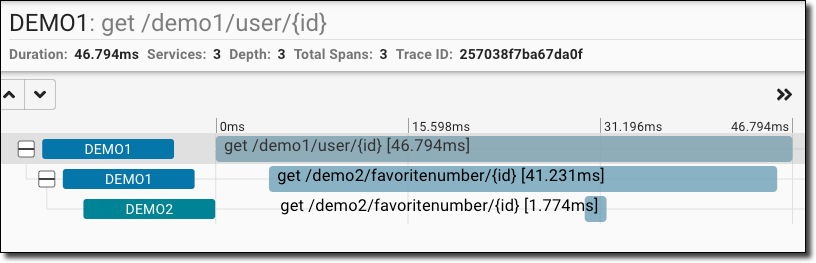
Now drill in to one of the /user/{id} calls (by clicking on ‘Show’) to see the spans from demo2 included in the trace.
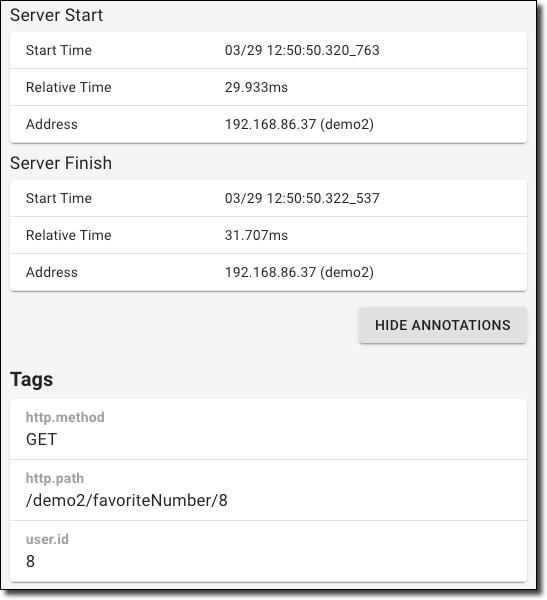
Click on the ‘Demo2’ span to highlight the row and then click ’Show Annotations’ on the right-hand side to view span details and the user.id that we tagged with the @SpanTag annotation.
We can also use the user.id to query spans.
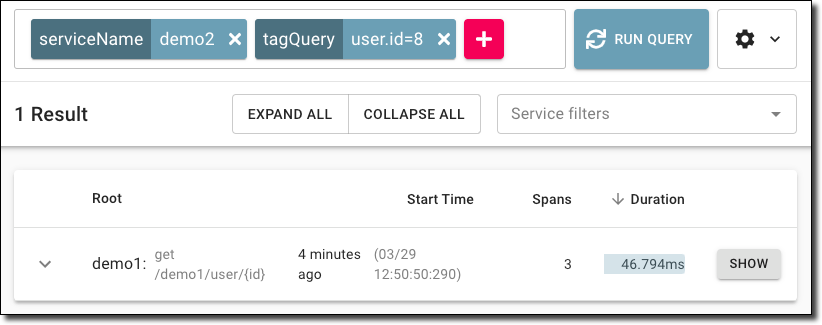
As you can see, tracing distributed microservices with Micronaut and Zipkin is not difficult. However, it does require that you install, configure, maintain, and secure your own Zipkin install. For larger teams with a strong DevOps presence, this isn’t a problem. But for smaller teams or organizations who don’t have the resources to dedicate to infrastructure management, is there a managed service option? The answer to that question is almost always “yes”, but that answer invariably leads to the next obvious question: “how difficult is it to migrate to the managed option and what will it take to migrate off of it if we ever have to”? Those are fair questions - and as usual with Oracle Cloud Infrastructure, you have an option that is fully compatible with the popular industry standard that can be dropped in with just minor config changes. Let’s look at using Application Performance Monitoring for our tracing endpoint instead of Zipkin.
Using OCI Application Performance Monitoring as a Drop-In Tracing Replacement
OCI Application Performance Monitoring (APM) is a suite of services that give you insight into your applications and servers running in OCI via a small agent that runs on the machine and aggregates and reports metric data. It’s a nice service to monitor and diagnose performance issues. It also includes a Trace Explorer that is Zipkin (and Jaeger) compatible and we can use that Trace Explorer from our Micronaut applications (even without taking full advantage of APM via the Java Agent). Let’s swap out Zipkin for APM Trace Explorer in our microservices.
Create Cloud Configuration
In the demo1 project, create a new file in src/main/resources/ called application-oraclecloud.yml. This file will automatically be used when your application runs in the Oracle Cloud thanks to Micronaut’s environment detection features.
Do the same for demo2.
Create an APM Domain
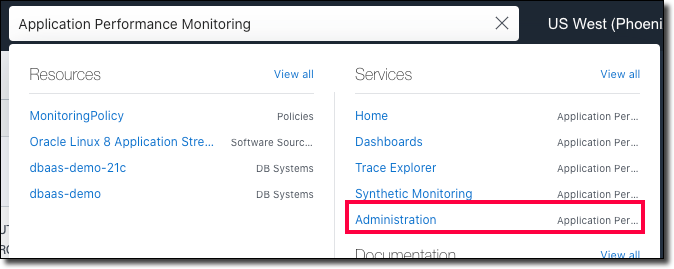
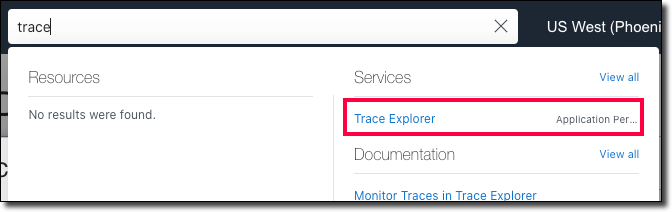
Now, in the OCI console, create an APM domain. We’ll share a single domain that will be used to group and trace all of our services. I know that may seem a bit confusing given the name ‘domain’, but think of it more like a “project group” or an “environment” (you may want to create separate domains for QA, Test, Prod, etc). Search for ‘Application Performance Monitoring’ and click on ‘Administration’.
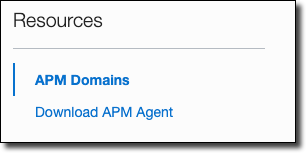
In the left sidebar, click on ‘APM Domains’.
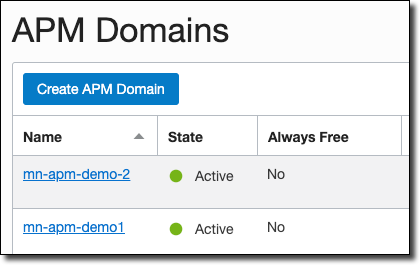
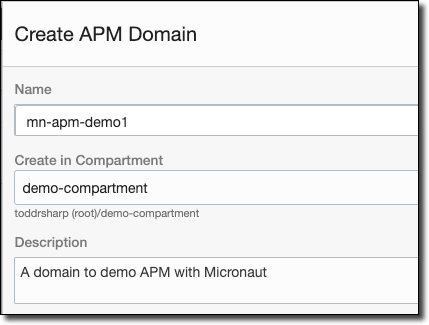
Click on ‘Create APM Domain’.
Name it, choose a compartment and enter a description.
Once the domain is created, view the domain details. Here you’ll need to grab a few values, so copy the data upload endpoint (#1), private key (#2), and public key (#3).

Now we have what we need to construct a URL to plug in to our application config files. The ‘Collector URL’ format requires us to construct a URL by using the data upload endpoint as our base URL and generate the path based on some choices including values from our private or public key. The format is documented here. Once we’ve constructed the URL path, we can plug it in to our application-oraclecloud.yml config. Since we use the same domain for both services, the URL and path would be the same for both config files.
If you wanted to keep these values out of the config file, you could alternatively set them as environment variables on the server like so:
And that’s it! Just by creating an APM domain and plugging in our new URL and path our application will start producing tracing data to APM. We can run a few requests and then head to the Trace Explorer in the OCI console to view, search and filter our traces just like we did in Zipkin.
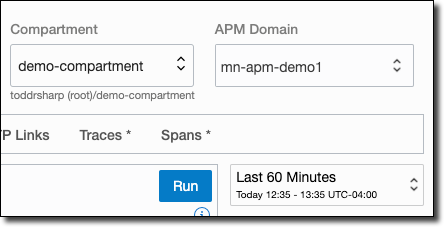
Choose your APM domain in the top right and the time period that you’d like to view/search.
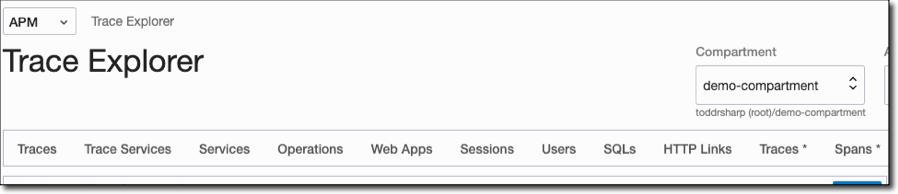
Choose one of the available pre-configured queries across the top.
View traces and spans:
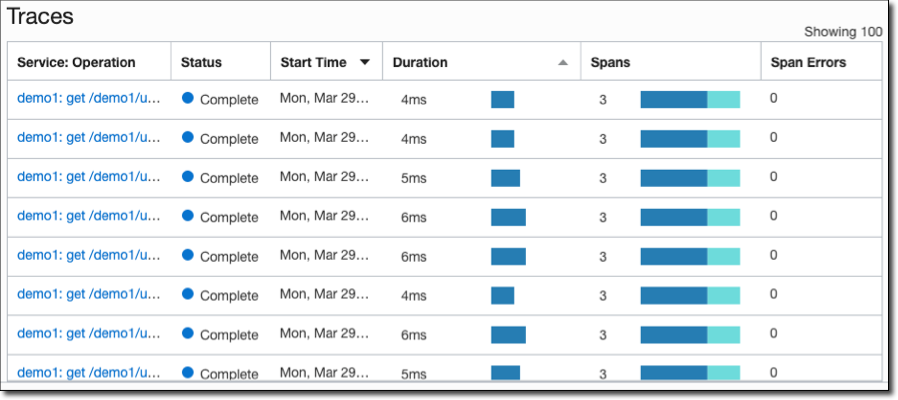
Click on a trace to view detailed info.
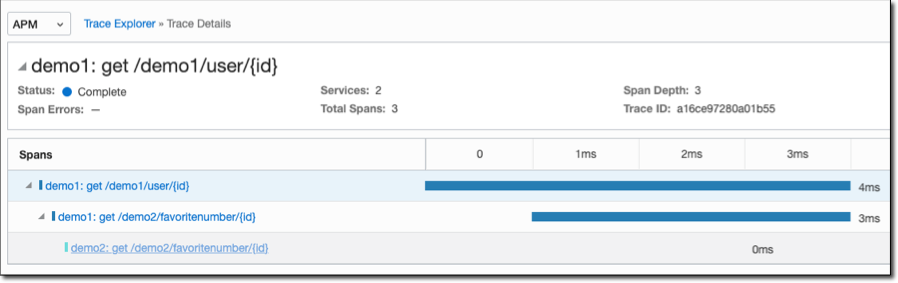
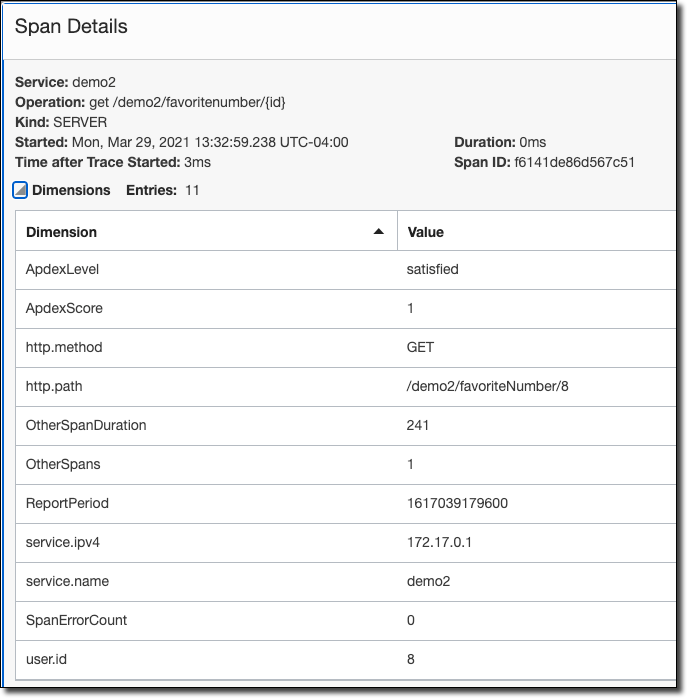
Click on a span inside a trace to view detailed info and tagged values.
Read more about the Trace Explorer in the documentation.
Summary
In this post, we looked at how to use tracing to gain insight into our Micronaut microservices. We first looked at using Zipkin, then we switched to the fully managed OCI Trace Explorer with nothing but a few changes to our configuration.
If you’d like to see the code used in this demo, check out the following GitHub repos.
I hope you enjoyed this look at tracing in the cloud. If there is another topic you’d like to see covered here on the developer blog, please drop a comment below!
Image by Free-Photos from Pixabay
Related Posts

Querying Autonomous Database from an Oracle Function (The Quick, Easy & Completely Secure Way)
I've written many blog posts about connecting to an Autonomous DB instance in the past. Best practices evolve as tools, services, and frameworks become...

Sending Email With OCI Email Delivery From Micronaut
Email delivery is a critical function of most web applications in the world today. I've managed an email server in the past - and trust me - it's not fun...

Brain to the Cloud - Part III - Examining the Relationship Between Brain Activity and Video Game Performance
In my last post, we looked at the technical aspects of my Brain to the Cloud project including much of the code that was used to collect and analyze the...